Jump to content


Photo

[Bicycles] Bike lanes and cycling infrastructure in Victoria and the south Island


  • Please log in to reply
11042 replies to this topic

#5801 spanky123

spanky123
  • Member
  • 21,005 posts

Posted 11 January 2018 - 04:45 PM

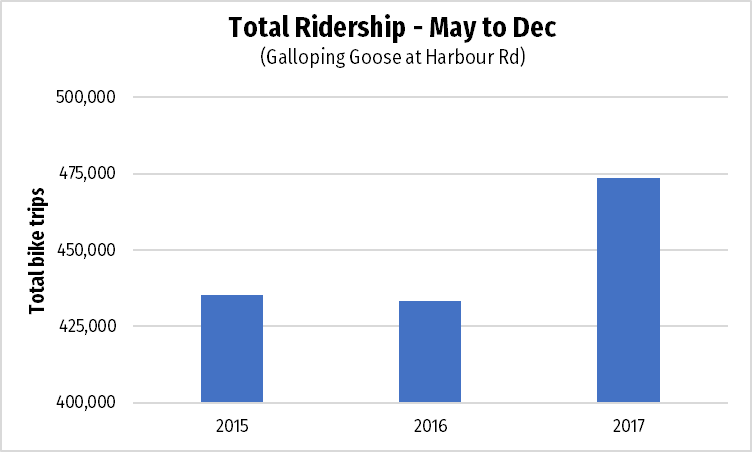
Ridership on the Galloping Goose Regional Trail grew by more than 9% from May to December 2016/2017 after the May 2017 opening of the Pandora protected bike lane, according to numbers from the City of Victoria & the CRD’s automated counter on the Galloping Goose Trail at Harbour Rd.

http://gvcc.bc.ca/go...andora-opening/


I noted from the report that the average daily temperature has dropped each of the past 2 years. I guess that means the end of global warming!


#5802 sebberry

sebberry

    Resident Housekeeper

  • Moderator
  • 21,507 posts
  • LocationVictoria

Posted 11 January 2018 - 04:49 PM

Ridership on the Galloping Goose Regional Trail grew by more than 9% from May to December 2016/2017 after the May 2017 opening of the Pandora protected bike lane, according to numbers from the City of Victoria & the CRD’s automated counter on the Galloping Goose Trail at Harbour Rd.
http://gvcc.bc.ca/go...andora-opening/


From the GVCC:

GooseRidership.png


And the same data represented in a visual that isn't manipulated to look like ridership doubled:

Capture.JPG
  • Mike K., Nparker, rjag and 3 others like this

Victoria current weather by neighbourhood: Victoria school-based weather station network

Victoria webcams: Big Wave Dave Webcams


#5803 rjag

rjag
  • Member
  • 6,363 posts
  • LocationSi vis pacem para bellum

Posted 11 January 2018 - 05:02 PM

Wow Seb that first graph makes it look like its grown by a hundred bazillion! amazing what a bit of creative graphing can create!


So a daily average of 1,700 or monthly average of 59,000. Compared to the prior year of approx 1560 per day or monthly 54,000. 140 trips per day or possibly an extra 70-80 people per day....let that sink in...an extra 70-80 people per day


Assuming most of these are round trip this is a daily average of 850. I wonder how many are commuting and how many in December compared to July and October?


Meanwhile Pandora at Blanshard gets 12,000 vehicles per day or 414,000 vehicle movements per month and with the work done this means traffic volumes has increased 50% per lane from 4,000 per lane per day to 6,000 per lane per day.....That makes sense...


  • A Girl is No one likes this

#5804 Mike K.

Mike K.
  • Administrator
  • 83,469 posts

Posted 12 January 2018 - 07:11 AM

Why does the GVCC have to manipulate information like this? They are not doing themselves any favours by presenting the graph the way they did.

Many people still remember their “data” that proved cyclists are more likely to be shoppers than any other group downtown, despite merchants wondering what on earth they were talking about. That and Ed Pullman’s odd behaviour on social media (commenting to people with anti-cycling viewpoints that their employers could end up seeing their comments, stuff like that) gives people an odd vibe when it comes to the organization.
  • rjag and A Girl is No one like this

Know it all.
Citified.ca is Victoria's most comprehensive research resource for new-build homes and commercial spaces.


#5805 rjag

rjag
  • Member
  • 6,363 posts
  • LocationSi vis pacem para bellum

Posted 12 January 2018 - 07:29 AM

Because graphs like that and claims of 9% make it look like an amazing uptake by many people that look at this stuff without delving further in. Nothing wrong with making a claim of 9% growth.... no lie, its 9% growth. Makes folks imagine hordes of new users. 


Politicians love %stats like this 


Lisa will be waving this as part of her 'I told you so' election tour and will simply neglect to convert the 9% to the actual user number claiming thats immaterial.


Did you know that new vehicle registrations on Vancouver Island grew by 10.5% from 2012-2016, 60,000 more vehicles on the Island in those 5 years...thats a number


  • Nparker likes this

#5806 Cassidy

Cassidy
  • Banned
  • 2,501 posts
  • LocationVictoria

Posted 12 January 2018 - 07:31 AM

The danger with the GVCC's octane-induced agenda is that when they present "data" that is so visually manipulated, regular folks automatically stop reading and believing anything at all that originates from the GVCC propaganda office.

In actual business, the presenter of a graph like this, one that so poorly represented the actual data would either be severely chastised by their employer, or completely removed from the project.


Responsible advocacy groups always need to ensure that they always pay close attention to their membership ranks, executive, and original mandate - this to ensure that they don't unintentionally transition into a closed-minded, zealot driven, untrustworthy manipulator of false information.


  • Nparker likes this

#5807 VicHockeyFan

VicHockeyFan
  • Suspended User
  • 52,121 posts

Posted 12 January 2018 - 07:40 AM

Residents living around the Cook Street corridor are mobilizing to oppose proposed changes to Cook Street  to make way for bike lanes.  Spokesman Robert McConnell says the group includes cyclists, and while they aren't opposed to bike lanes they have severe concerns about putting them on Cook Street, particularly lower Cook from Pandora to Southgate.


McConnell says Cook is the only north-south arterial street east of the downtown core, serving an estimated 18-thousand vehicles a day including  cars, buses, delivery trucks, and emergency vehicles.


McConnell is calling on council to take another look, and hold an open session with city staff where they go into detail about the broader implications of jamming Cook Street traffic into 2 lanes:


" If they still after that think it's a good idea to proceed, then we want them to do a test.  A very simple test. Simply block off the 2 curb lanes on Cook Street for a few days, and see what happens to the traffic."


McConnell says his group has serious safety concerns about the Victoria bicycle plan, and does not feel there has been enough consultation with residents. They feel there are other options for bikes lanes, including Vancouver Street.


http://www.iheartrad...lanes-1.3549734


Edited by VicHockeyFan, 12 January 2018 - 07:40 AM.

  • Nparker, rjag and A Girl is No one like this
<p><span style="font-size:12px;"><em><span style="color:rgb(40,40,40);font-family:helvetica, arial, sans-serif;">"I don’t need a middle person in my pizza slice transaction" <strong>- zoomer, April 17, 2018</strong></span></em></span>

#5808 rjag

rjag
  • Member
  • 6,363 posts
  • LocationSi vis pacem para bellum

Posted 12 January 2018 - 07:56 AM

Saanich did a similar test on Lansdowne by Camosun 2 years ago in August before school was in session and it was an utter disaster. The test was supposed to last 2 weeks and they pulled it after a week. complete gridlock and this was before we add in the UVic and Camosun commute. Thats why the road remained at 2 lanes there.


I wish they had done the same on Cedar Hill X and McKenzie as those are a disaster at peak travel times  


#5809 mbjj

mbjj
  • Member
  • 2,350 posts

Posted 12 January 2018 - 08:03 AM

I read an article that in spite of high taxation, car sales are up in Denmark, lol.


#5810 Mike K.

Mike K.
  • Administrator
  • 83,469 posts

Posted 12 January 2018 - 08:59 AM

CFAX has the Cook Street Village folks in studio right now.

They’re not happy, at all. This will go over about as well as the Topaz Park tent city.

Know it all.
Citified.ca is Victoria's most comprehensive research resource for new-build homes and commercial spaces.


#5811 Ismo07

Ismo07
  • Member
  • 5,224 posts

Posted 12 January 2018 - 09:02 AM


Meanwhile Pandora at Blanshard gets 12,000 vehicles per day or 414,000 vehicle movements per month and with the work done this means traffic volumes has increased 50% per lane from 4,000 per lane per day to 6,000 per lane per day.....That makes sense...


Johnson and Douglas (where it's always been 2 lanes) have had similar numbers to Pandora with respect to traffic volumes, even more actually through the years.  I think Pandora is handling those vehicles, but will be interesting to see newer car counts since the reduction in the lane.  The only issue with traffic movements I've seen really concentrate where only one lane goes across the bridge so in the late afternoon there is quite a lot of congestion there from Store up to Douglas at times.  That should be rectified with the bridge opening.


Again not really for or against anything here, the lanes will need some time once they are completed to really get a sense of the value of the lanes to really understand if we see a reduction in vehicle trips.  I've just read an article which states 50% of all car trips are less than 3 miles.  Further it goes on to say that 72% of all trips less than 3 miles are taken by vehicle.  Those are staggering numbers for very short trips.  I don't believe the intent is to get everyone out of a vehicle but if over a couple years 10% of the vehicle trips are reduced, even if just in the nicer 2/3 of the year that would be helpful. 


I'm still a fan of a wait and see approach here like in most circumstances.  I know this, more people have ridden bikes east on Pandora than ever before.  I'm not sure I can even make a graph on that one.  Oh and groups and associations have forever made graphs where the axis do not begin with the same reference.  It's cheating for sure.


  • Mike K., rjag, nerka and 1 other like this

#5812 Jason-L

Jason-L
  • Member
  • 1,257 posts

Posted 12 January 2018 - 10:02 AM

Again not really for or against anything here, the lanes will need some time once they are completed to really get a sense of the value of the lanes to really understand if we see a reduction in vehicle trips.  I've just read an article which states 50% of all car trips are less than 3 miles.  Further it goes on to say that 72% of all trips less than 3 miles are taken by vehicle.  Those are staggering numbers for very short trips.  I don't believe the intent is to get everyone out of a vehicle but if over a couple years 10% of the vehicle trips are reduced, even if just in the nicer 2/3 of the year that would be helpful.

Is that really staggering?


3 miles (~5km) is about an hour walking, assuming average speed... or 10 minutes at 30km an hour, right?  So if I need to go to the store to grab a few things, I can decide to walk an hour there, spend 15 minutes making my purchases, and walk an hour back (now carrying those purchases)... or I can drive 10 minutes, spend 15 minutes making my purchases, and 10 minutes to get home.  So ~half an hour versus ~2.5 hours? Even with bad traffic, I'm still likely only 20 minutes in the car there, 20 minutes back and still save an hour or more on the trip.


  • Midnightly likes this

#5813 nerka

nerka
  • Member
  • 1,236 posts

Posted 12 January 2018 - 10:12 AM

^ Not many people would walk 6 miles return for an errand I agree.


But what if the distance is half that and you hop on a bike? Then you have got 10 minutes each way. Maybe less time parking at your destination and you got some exercise to boot.


  • Coreyburger likes this

#5814 nerka

nerka
  • Member
  • 1,236 posts

Posted 12 January 2018 - 10:23 AM

I don't find that graph above terribly misleading. The y-axis is clearly labelled. Clearly it is intended to emphasize the change, but that is a legitimate story to tell. 


There isn't and shouldn't be a hard and fast rule about starting y-axes at zero.

  • If I was plotting Canadian GDP over the last 10 years I wouldn't start the axis at zero.
  • If I was plotting trends in workforce participation I wouldn't start the axis at zero.
  • If I was plotting intraday stock price movements I generally wouldn't start the axis at zero
  • If I was plotting daily changes in temperature in Victoria I wouldn't start the axis at zero Kelvin
  • If I was looking at mortality data trying to discern the effects of an epidemic or a severe weather event I would not start my graphs at zero

I'd agree that if you don't start the y-axis at zero and also fail to label the axis then you are probably lying or misleading.


#5815 Ismo07

Ismo07
  • Member
  • 5,224 posts

Posted 12 January 2018 - 11:38 AM

Is that really staggering?


3 miles (~5km) is about an hour walking, assuming average speed... or 10 minutes at 30km an hour, right?  So if I need to go to the store to grab a few things, I can decide to walk an hour there, spend 15 minutes making my purchases, and walk an hour back (now carrying those purchases)... or I can drive 10 minutes, spend 15 minutes making my purchases, and 10 minutes to get home.  So ~half an hour versus ~2.5 hours? Even with bad traffic, I'm still likely only 20 minutes in the car there, 20 minutes back and still save an hour or more on the trip.


Yes I think if 50% decide to drive 3 miles (or much less in cases) every day as a commute when some (10%) could utilize another means to get to work and back if it was made easier.  I'm sure people that live within 3 miles of their work already figure another way but if we can get more by removing potential barriers.


Totally understand going to grab a slurpee or something someone would drive but someone else might ride if it felt safe.  Can we agree that some people may choose to ride, say from Fernwood or Fairfield to the downtown core rather than drive for an errand if there was a safer route available?


Find it curious people will drive 10 miles so they can walk for 5 :).


Edited by Ismo07, 12 January 2018 - 11:52 AM.


#5816 Ismo07

Ismo07
  • Member
  • 5,224 posts

Posted 12 January 2018 - 12:22 PM

I don't find that graph above terribly misleading. The y-axis is clearly labelled. Clearly it is intended to emphasize the change, but that is a legitimate story to tell. 


I would agree to some extent but would you really create a graph that makes it look like 100% increase when it is really 8%?  I'm not sure how many people really examine the graph rather than look at the size (it does matter).  Rjag was fooled.  What if the X axis started at 425k and increased by 10k or X started a 0 and increased by 100k?  I'm not sure it's entirely honest to make the axis to whatever scale you'd like while it's correct, I wouldn't agree it's fair.  Easy to tell what the story is intended to tell and equally easy to show who created it.  Graphing manipulation might be more dangerous than interpreting stats.


  • Nparker and Midnightly like this

#5817 Mike K.

Mike K.
  • Administrator
  • 83,469 posts

Posted 12 January 2018 - 12:29 PM

Optics, folks, optics.


If you're the GVCC, and you're trying to lobby the city and actively change people's perception of cycling as a means of transportation worthy of the upheaval, the expense and the division it may be creating (in the short term, hopefully), you do not engage in practices that grow that divide.


Manipulating visual data just tarnished the news of positive growth in cycling activity. We went from something positive (growth in usage) to questioning the integrity of the organization who published the stats (a negative).


Know it all.
Citified.ca is Victoria's most comprehensive research resource for new-build homes and commercial spaces.


#5818 thundergun

thundergun
  • Member
  • 1,172 posts
  • LocationVictoria

Posted 12 January 2018 - 12:37 PM

I really don't understand the need for a graph at all. It clearly stated an increase of 9% - that's not the kind of complex data that needs a visual medium to comprehend.


  • Nparker likes this

#5819 rjag

rjag
  • Member
  • 6,363 posts
  • LocationSi vis pacem para bellum

Posted 12 January 2018 - 12:49 PM

I would agree to some extent but would you really create a graph that makes it look like 100% increase when it is really 8%?  I'm not sure how many people really examine the graph rather than look at the size (it does matter).  Rjag was fooled.  What if the X axis started at 425k and increased by 10k or X started a 0 and increased by 100k?  I'm not sure it's entirely honest to make the axis to whatever scale you'd like while it's correct, I wouldn't agree it's fair.  Easy to tell what the story is intended to tell and equally easy to show who created it.  Graphing manipulation might be more dangerous than interpreting stats.


Hehe, I wasnt fooled, my comment to Seb was sarcasm. My immediate reaction when seeing data like this is to look at it from different angles to see if the claim is as substantial as advertised....in this case an extra 80 odd round trip commuters isnt that much of a number compared to all the people that commute in our region


#5820 Mike K.

Mike K.
  • Administrator
  • 83,469 posts

Posted 12 January 2018 - 02:45 PM

May 01 - December 31 = 245 days


2015: 435,335 one-way trips / 2 = 217,668 commutes/origin-to-origin trips / 245 = average of 888.4 people per day

2016: 433,143 / 2 = 216,571 / 245 = 884 people per day (4 fewer people than in 2015)

2017: 473,547 / 2 = 236,773 / 245 = 966.4 (78 more people than in 2015)


So the data represents an average of 78 individuals more crossing the counter at Harbour Road, per day, in 2017 than in 2015.


Corey writes: "Ridership on the Galloping Goose Regional Trail grew by more than 9% from May to December 2016/2017 after the May 2017 opening of the Pandora protected bike lane, according to numbers from the City of Victoria & the CRD’s automated counter on the Galloping Goose Trail at Harbour Rd."


However, what's not being mentioned is that a bicycle retailer and bicycle rental shop opened in the spring of 2016 immediately adjacent to the counter. By the spring of 2017 the bicycle store and rental kiosk would have been in full swing.


Is it, therefore, not reasonable to assume that a sizeable portion of the additional bicycle traffic (a portion of the 78 people per day, on average) could be tied to trial rides or test rides by customers of the bicycle store who are more likely to take a test ride on the Goose in lieu of Harbour Road and environs? Is it also more likely that those renting bicycles would be inclined to ride them down the Goose, in lieu of towards downtown Victoria?


I don't have the answers to those questions, but I think it's only fair for the GVCC to acknowledge that a bicycle store is now operating adjacent to the counter and is likely to have an impact on the counter via its clients testing bicycles and bike renters heading north along the Goose.


Image courtesy of Gary H

bike-rental.jpg


  • Matt R., Midnightly and A Girl is No one like this

Know it all.
Citified.ca is Victoria's most comprehensive research resource for new-build homes and commercial spaces.


You're not quite at the end of this discussion topic!

Use the page links at the lower-left to go to the next page to read additional posts.


6 user(s) are reading this topic

0 members, 6 guests, 0 anonymous users