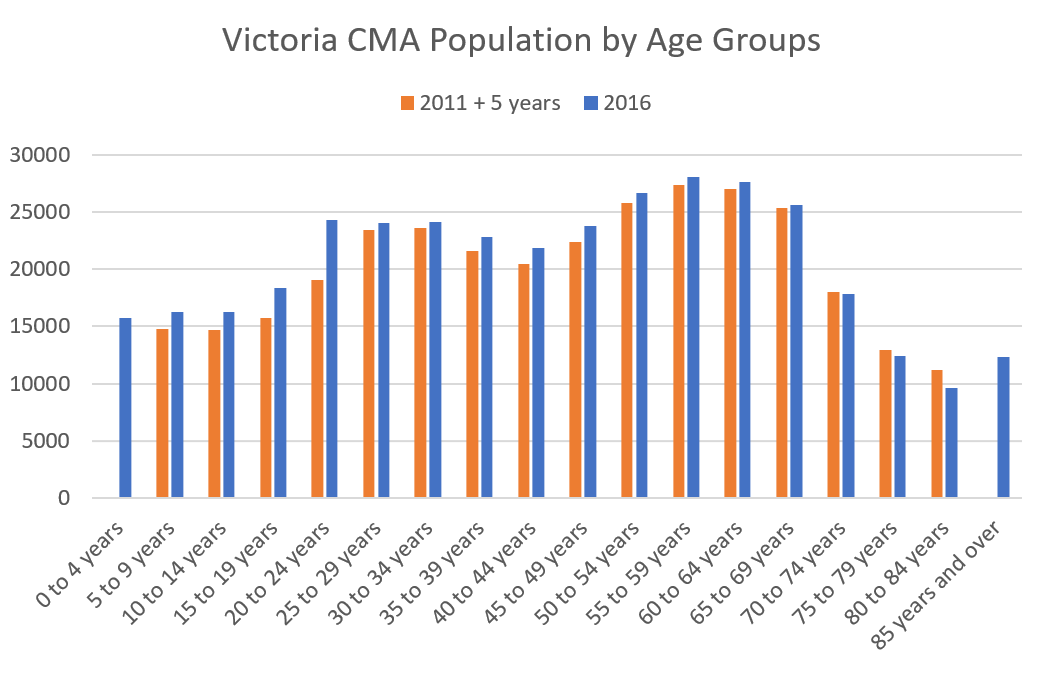
Your interpretation of the data incorrectly describes the population growth in this region and your rationale is not backed up by the data. The cohort aged 45+ grew literally twice as fast as the cohort aged 0-to-44 between 2011 and 2016, and it is not "a small factor" as you describe above.
The median age has increased from 43 to 45 over the last three census periods. For your theory to hold the median age would not be increasing at the magnitude that it is, and could actually decrease.
Considering the following:
Individuals aged 0-44
2006: 174,540
2011: 175,560 (+0.6%)
2016: 183,845 (+4.7%) 8,285 people
Individuals aged 45+
2006: 155,565
2011: 168,865 (+8.6%)
2016: 183,925 (+8.9%) 15,060
It is impossible to infer from the census data that it is individuals aged below the age of 45 that represent the largest cohort of newcomers to this region.
In fact, for the first time ever, I think, the population of individuals aged 45 and older is higher than individuals aged 0-to-44.